In this third installment, (see Post 1 and Post 2; Posts 4 and 5 to come soon), we will look at how publishers fared in 2011, as compared to 2010. The chart below shows our dashboard view of the large publishers’ results for 2011. The most notable piece of information is that Wiley continues to hold the leading spot as the largest publisher (with 32% market share of units sold), while Pearson and O’Reilly both lost 1%, which is picked up by Cengage and McGraw Hill. (We’ll look at revenue share later in the analysis.)
| 2010 Pub Share | 2011 Pub Share |
 |
 |
You may not recognize the names of all the top publishers, because they are actually conglomerates of many smaller publishing imprints that they’ve acquired, created or distributed over the years. The imprints are the familiar consumer-facing brands. For instance, when you purchase a book from Peachpit or Sams, you typically see Peachpit or Sams on the spine, not Pearson, even though Pearson owns both companies. In O’Reilly’s case, all the imprints that are not branded “O’Reilly” are part of a distribution partnership and are not owned by O’Reilly. The various imprints that make up each major publisher’s share are shown in detailed pie charts later in this post.
Let’s look at the top publishers and how they performed year-over-year. The following table provides some interesting comparative data.
| Publisher | 2010 Units | 2011 Units | 2010 Title Count | 2011 Title Count | 2010 Efficiency | 2011 Efficiency |
| Wiley | 1,887,493 | 1,919,065 | 1,538 | 1,624 | 1.65 | 1.68 |
| Pearson | 1,386,301 | 1,450,504 | 1,934 | 1,893 | 0.97 | 1.09 |
| O’Reilly | 1,404,607 | 1,327,487 | 1,145 | 1,219 | 1.65 | 1.55 |
| McGrawHill | 276,439 | 251,691 | 466 | 451 | 0.80 | 0.79 |
| Apress | 200,267 | 170,673 | 423 | 481 | 0.64 | 0.50 |
| Cengage | 167,020 | 163,520 | 676 | 674 | 0.33 | 0.34 |
| Reed Elsevier | 140,708 | 145,766 | 384 | 392 | 0.49 | 0.53 |
| Lightning Source | 77,128 | 79,270 | 428 | 560 | 0.24 | 0.20 |
| Sum/Avg | 5,539,679 | 5,507,976 | 6,996 | 7,296 | 0.845 | .835 |
So what is notable in this data? First, of the big three publishers (more than 1 million units per year) only O’Reilly had netted fewer units in 2011 than in 2010. Second, these top eight publishers produced a modest decrease in 2011. Overall, these top eight publishers collectively saw -31,703 fewer units sold in 2011, with 300 additional titles making the list which decreased the efficiency by .10.
A note on Market Share versus Title Efficiency
A typical indicator of publisher performance is market share of units sold, which is what we’ve been looking at so far. Perhaps a better measure is how many published titles it takes to get a comparable share of unit sales. This is the ratio of title share to unit market share. Think about it this way: if a publisher has 15% of the titles appearing in the Bookscan Top 3000, and gets a 15% share of units sold, they will have a ratio of 1:1, expressed as a title efficiency of 1.0. A publisher with 20% of the title share, and 10% of the unit share would have a .5 efficiency. An efficiency of 1 is the market average: 100% of the title count delivering 100% of the unit sales. A publisher that achieves its share with fewer titles will have a higher ratio. In 2011 three publishers continue to have an efficiency of more than 1: Wiley, Pearson, and O’Reilly, where the first two saw an efficiency increase while O’Reilly saw a slight decrease.
Publishers under the 1.0 threshold typically have many titles in the Bookscan data, but they are not selling many units. A note of caution though, some publishers have many evergreen titles, which can skew this data. Typically, older titles sell fewer units each subsequent year. But this is not always true, as some titles continue to sell like they are newly released. Head First Design Patterns is one example, still selling more than the majority of brand-new titles. So efficiency could be thought of as a frequency ratio rather than a true efficiency measure, because it is very efficient to publish a title and have it sell for years. A true efficiency metric would take into account all titles published by all publishers and how many make it into the Top 3000. Another caution is that many titles have new editions release every few years so those titles will not become evergreen. And some publishers have titles that never make the Top 3000, so we will not be able to count them (for or against an efficiency metric) because they are missing from the dataset.
A Note on Evergreen Status
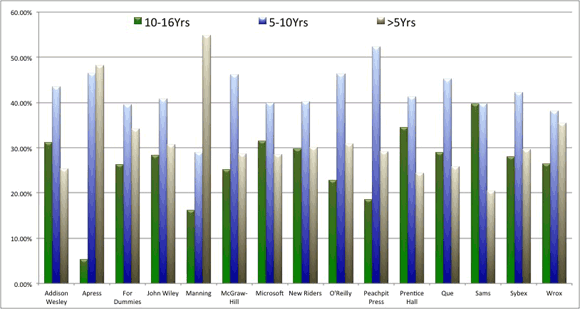
The chart below shows imprints that have a percentage of titles aged in ranges from 10-16 years, 5-10 years, and less than five years. The 10-16 range is the evergreen status and the bar indicating that is green. This is different than last year’s table that awarded points. This is purely titles that were published between X date and now. Surprisingly it looks as though Microsoft Press and New Riders are the most balanced, whereas Sams, Prentice Hall and Addison Wesley are more on the evergreen side of things. Manning, Apress and Wrox are the publishers more heavily weighted in the less than five years area.
Now that we have a basic understanding of title efficiency and evergreen status, let’s look further into the 2011 results for the imprints and drill in on the top three publishers: Wiley, Pearson, and O’Reilly. This is important because you typically see the imprint name on a book when you purchase it, but may not be aware of who the publisher is. (You’ll likely see the Publisher name inside the book on the copyright page, except in the case of O’Reilly because our other imprints are distribution partners. That is, O’Reilly provides some sales and distribution services to these partners, but they are not owned by O’Reilly as is the case for the Pearson and Wiley imprints.)
Click on any chart to get a bigger image.
| #1 Wiley | #2 Pearson |
 |
 |
| #3 O’Reilly Media, Inc. | |
 |
|
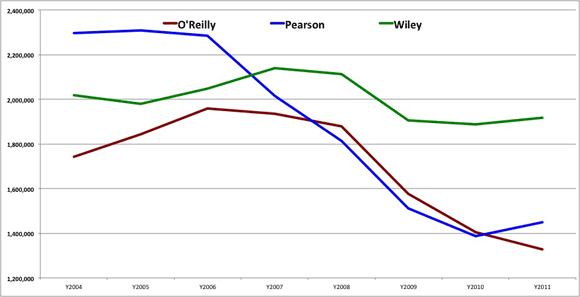
In 2011, Pearson moved past O’Reilly Media to reclaim their previously held spot as the second largest publisher. Again, this view is with all imprints and partners aggregated together. In the chart immediately below, I have included all partners and imprints and displayed the overall trend for the three large publishers between 2004 and 2011. Wiley continues to dominate as the largest publisher and seems to be more resilient to the market declines, chiefly due to the Dummies brand and its wide-ranging scope. The Wiley Publishing group started a decline in 2008 with Pearson and O’Reilly, but stopped its decline in 2009 and has been slightly up since then, while the other two continued their decline. Pearson rallied last year and turned their trend towards growth. O’Reilly has some work to get the ship turned around and moving in a positive direction again.
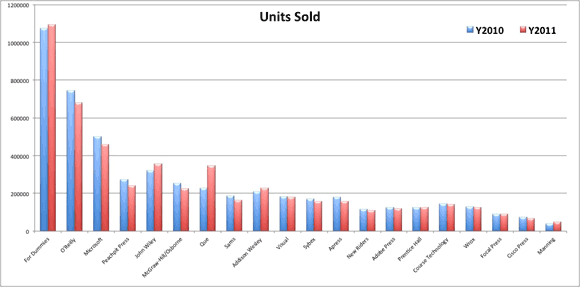
Now that you have an idea of the imprints that make up the largest three publishers, let’s tease out all the imprints and look at their respective market share. The following chart shows the top 20 imprints and how they stack up against each other and the prior year. Of the 20 imprints, only five saw more units sold in 2011 than in 2010. The list is sorted by overall units sold between 2004 and 2011 — that is why PeachPit is shown fourth on the chart yet both Wiley and Que have larger market shares for 2011 and Wiley is ahead of PeachPit for the prior two years.
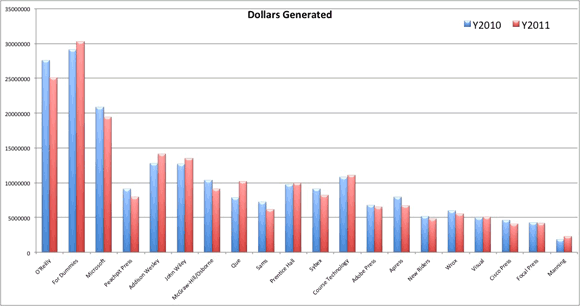
Before analyzing imprints by category, let’s revisit this same data with dollars rather than units. We have a fairly easy way of calculating this: units sold * listprice = dollars. Granted there are discounts, promotions, and other things that affect the precision of this, but it is a pretty good measure of market trends. If nothing else, you can think of this as retail dollar value. So here are the top imprints from a revenue perspective. Again, this is at the imprint level and from a dollar perspective. As you can see, compared to the units chart above, the leaderboard changes. O’Reilly Media becomes the number one revenue-producing imprint (by overall descending order 2004-2011), followed by Dummies, and then Microsoft Press. The biggest move in the top 20 is that Addison-Wesley jumps from #9 in units to #5 in dollars, and conversely, Wiley’s Visual imprint goes from #10 in Units to #17 in Dollars. The order in which the imprints are placed on the chart is based on their overall dollars generated during the period between 2004 and 2011. You can see that Wiley would displace O’Reilly as the top for the previous two years, and PeachPit has several imprints that would move them further down the list when looking at the most recent two years. Course Technology is another imprint to note here as they have experienced a couple outstanding years and would place them 6th overall for the combined previous two years, even though they are placed in the 12th position on the chart based on their 8-year history.
Imprint analysis by category
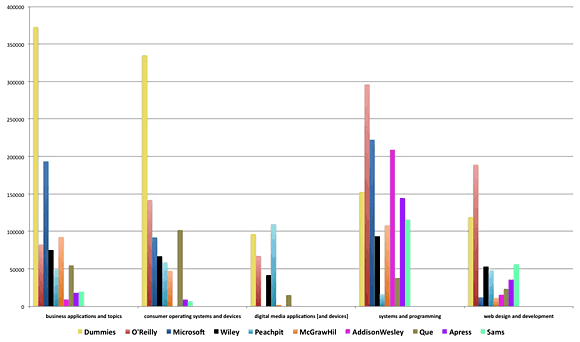
Now that we have seen a high-level picture of what imprints did in 2011, let’s take a look at which categories each of them publishes in and where their strengths lay. Dummies and O’Reilly appear to have the most diverse publishing programs, as they are not at the bottom in any category and have respectable market share in each. Dummies is clearly the leader in Business Apps and Consumer Operating Systems, while O’Reilly maintains a sizable lead over Addison Wesley in the Systems and Programming category. This chart also seems to indicate that Addison-Wesley is really only publishing in the System and Programming space, with a little in Web Design and Development.
Categories and the publishers that dominate them
The following category images are for 2011, and the tables have each publisher’s count of titles and sum of units. The top titles are also listed for each area in 2011.
Category: Systems and Programming
In this category, you can see that O’Reilly still has the largest market share among the publishers, with Pearson a close second. If we drill into this picture of the Publishers and down to the imprint level, the picture of who is driving market gets clearer. The top six imprints are O’Reilly at 13.00%, Addison-Wesley at 10.23%, Microsoft Press at 9.09%, For Dummies at 7.40%, McGraw Hill at 5.79%, and Prentice Hall at 5.35%. What is not obvious from this data is that a few percentage points have been swapped among the leaders. O’Reilly and Microsoft Press both saw modest decreases while Addison Wesley and McGraw Hill picked up the lost ground.
As you can see in the table below, O’Reilly has the most units, best average Units per title, and best title efficiency rating. It is a relatively healthy mix. That is, we do have quite a few titles and our efficiency is also significantly above the market average.
Sys & Prog – Publisher Market Share (01/01/2011 — 12/31/2011)
| Publisher | Units | Title Count | Units/Title | Efficiency |
| O’Reilly | 542,502 | 685 | 792 | 1.55 |
| Pearson | 525,106 | 944 | 556 | 1.09 |
| Wiley | 399,192 | 573 | 697 | 1.37 |
| McGraw Hill | 128,841 | 242 | 532 | 1.04 |
| Apress | 87,938 | 243 | 362 | 0.71 |
| Cengage | 79,099 | 278 | 285 | 0.56 |
| Lightning Source | 44,347 | 272 | 163 | 0.32 |
| Reed Elsevier | 36,405 | 183 | 199 | 0.39 |
Note: This is the first year that I can remember that the PMP book is not the leading title, with McGraw Hill’s title CompTIA A+ Certification All-in-One Exam Guide, Seventh Edition taking the top spot. It might be due to the PMP book having a new edition published in July of 2011 and it needs more time to gain back its momentum. It is also interesting to see that the other top five titles are all 2+ years old and O’Reilly’s two titles are seven and eight years old. Evidence that this is a category where evergreen titles perform well. The leading titles and publishers for Systems and Programming in 2011 were:
- CompTIA A+ Certification All-in-One Exam Guide, Seventh Edition (McGraw-Hill/Osborne)
- PMP Exam Prep: Rita’s Course in a Book for Passing the PMP Exam (RMC)
- Head First Java, 2nd Edition (O’Reilly Media, Inc.)
- Pro C# 2010 and the .NET 4 Platform (APress)
- Head First Design Patterns (O’Reilly Media, Inc.)
Category: Web Design and Development
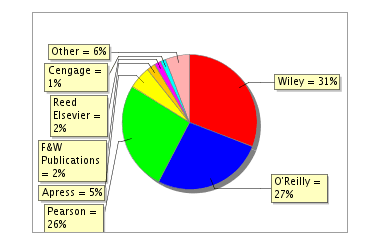
In this category, you can see that Wiley has the number one spot as a Publisher any O’Reilly has moved into the second spot ahead of Pearson. When we drill into the imprint level, the picture changes a bit. The top five imprints are O’Reilly at 19.84%, Dummies at 16.51%, Wiley at 6.14%, New Riders at 5.35%, and Peachpit at 4.82%.
As you can see in the table below, Pearson still has the most titles but their performance is not as strong as Wiley and O’Reilly in efficiency and units, units per title, and efficiency. In Web Design and Development, we have come back to a state where the market is steady and most publishers are above the title efficiency average of 1.0. As you can see, all publishers except for Apress have an efficiency rating higher than 1.0. F&W Publications might want to consider publishing more with the way they came from nowhere to the number four spot with excellent efficiency.
Web Des & Dev – Publisher Market Share ( 01/01/2011 — 12/31/2011 )
| Publisher | Units | Title Count | Units/Title | Efficiency |
| Wiley | 241,222 | 236 | 1,022 | 1.54 |
| O’Reilly | 206,462 | 227 | 910 | 1.37 |
| Pearson | 203,382 | 279 | 729 | 1.10 |
| Apress | 42,372 | 140 | 303 | 0.46 |
| F&W Publications | 17,616 | 4 | 4,404 | 6.65 |
During the past two years combined (2010 & 2011), O’Reilly’s Learning PHP, MySQL, and JavaScript has dominated this category. The leading titles and publishers for Web Design and Development for 2011 are:
- Learning PHP, MySQL, and JavaScript: A Step-By-Step Guide to Creating Dynamic Websites (O’Reilly Media, Inc.)
- Don’t Make Me Think: A Common Sense Approach to Web Usability, 2nd Ed. (New Riders’ )
- Social Media Marketing All-in-One For Dummies (Dummies)
- Head First HTML with CSS & XHTML (O’Reilly Media, Inc.)
- WordPress For Dummies, 3rd Edition (Dummies)
Category: Business Applications
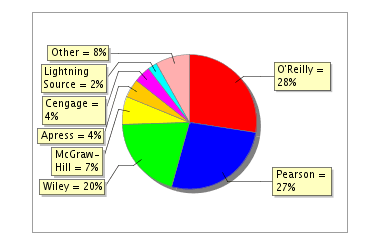
In this category you can see that Wiley has the largest market share among the publishers and O’Reilly (apologies: the O’Reilly 23% is obscured in the graph) continued to stay ahead of Pearson for second. If we drill into the imprint level, the picture changes a bit. The top six imprints are Dummies at 28.03%, Microsoft Press at 15.94%, John Wiley at 6.45%, O’Reilly at 5.80%, McGraw Hill/Osborne at 5.73%, and Visual at 4.52%.
Bus Apps – Publisher Market Share ( 01/01/2011 — 12/31/2011 )
| Publisher | Units | Title Count | Units/Title | Efficiency |
| Wiley | 549,301 | 390 | 1,408 | 1.73 |
| O’Reilly | 285,214 | 160 | 1,783 | 2.19 |
| Pearson | 188,039 | 281 | 669 | 0.82 |
| McGraw Hill | 77,813 | 97 | 802 | 0.98 |
| Cengage | 38,483 | 192 | 200 | 0.25 |
Microsoft Press’s Office Plain and Simple is the only non-Dummies title to make the top five in this category. Dummies clearly dominates this category. The leading titles and publishers for Business Applications are:
- Office 2010 All-in-One For Dummies (Dummies)
- Excel 2007 for Dummies (Dummies)
- QuickBooks 2011 For Dummies (Dummies)
- Facebook For Dummies (Dummies)
- Microsoft Office 2010 Plain and Simple (Microsoft)
Category: Consumer Operating Systems & Devices
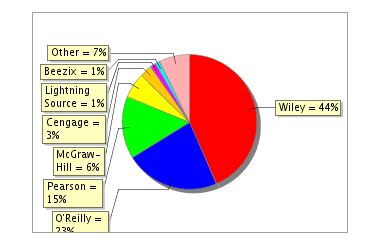
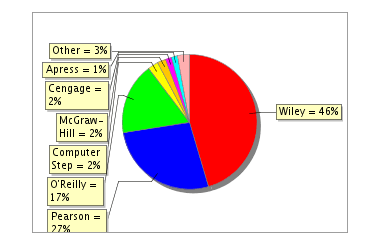
In this category, you can see that Wiley has the largest market share among the publishers with Pearson in second at 27%, and O’Reilly comfortably in the third spot at 17%. (Apologies: the Pearson percentage is partially cut off in the graph.) If we drill into the imprint level, the picture changes a bit. The top five imprints are Dummies at 31.38%, Que at 18.88%, O’Reilly at 11.87%, Wiley at 7.54%, and Wiley’s Visual at 6.68%. So when you combine Wiley, Dummies and Visual, you have a publisher that is nearing 50% of the market share.
As you can see in the table below, this is a category that supports a select few big publishers as there are three with efficiencies greater than 1.0. What is impressive with this category, is that it has three publishers averaging more than 1,000 units per title. To me, that means it’s a category that sustains numerous big-selling titles, not just an occasional retail success. As you can see from the best-selling titles below, Windows 7 continues to perform well, but the tablets and e-readers are what is driving this category in 2011.
Cons Opsys & Dev – Publisher Market Share ( 01/01/2011 — 12/31/2011 )
| Publisher | Units | Title Count | Units/Title | Efficiency |
| Wiley | 535,091 | 221 | 2,421 | 1.34 |
| Pearson | 316,575 | 132 | 2,398 | 1.33 |
| O’Reilly | 203,176 | 68 | 2,998 | 1.66 |
| Computer Step | 28,533 | 34 | 839 | .47 |
| McGraw Hill | 24,061 | 53 | 454 | 0.25 |
| Cengage | 17.665 | 76 | 232 | 0.13 |
What is impressive with the top-titles list below, is Que had zero titles in the top five in 2010, and in 2011 they have three including the top two. The leading titles and publishers for Consumer Operating Systems are:
- My iPad 2 (Que)
- The NOOK Book (Que)
- Windows 7 For Dummies (Dummies)
- Windows 7 For Dummies Book + DVD Bundle (Dummies)
- My iPhone (Que)
Category: Digital Media
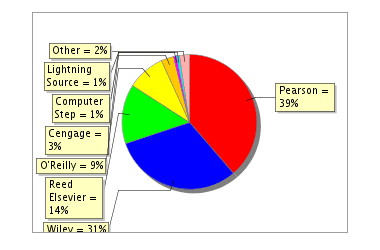
In this category, you can see that Pearson continues to hold the top spot, followed by Wiley (31% partly obscured) and then Reed Elsevier displaces O’Reilly for third among publishers. As you can see in the table below, Pearson has the most titles and a relatively good efficiency rating. O’Reilly leads the category with its extremely healthy efficiency rate and average units per title. This is a tough category for lots of publishers because many of the books are four-color and yet low priced. It is hard to make that combination work at a sustainable and profitable level.
If we drill into the imprint level, the picture changes a bit. The top six imprints are Peachpit at 16.46%, For Dummies at 15.40%, Focal Press at 14.15%, Adobe Press at 12.08%, New Riders at 9.24%, and O’Reilly at 7.98%.
Digital Media – Publisher Market Share ( 01/01/2011 — 12/31/2011 )
| Publisher | Units | Title Count | Units/Title | Efficiency |
| Pearson | 190,868 | 173 | 1,103 | 1.32 |
| Wiley | 153,647 | 149 | 1,031 | 1.24 |
| Reed Elsevier | 70,154 | 114 | 615 | 0.74 |
| O’Reilly | 44,495 | 31 | 1,435 | 1.72 |
| Cengage | 15,156 | 52 | 291 | 0.35 |
The leading titles and publishers for Digital Media are:
- Adobe Photoshop CS5 Classroom in a Book (Adobe Press)
- The Adobe Photoshop CS5 Book for Digital Photographers (Peachpit)
- Adobe Photoshop CS5 for Photographers (Focal Press)
- Photoshop Elements 9: The Missing Manual (O’Reilly)
- The Photoshop Elements 9 Book for Digital Photographers (Peachpit)
Next up, Post 4 will contain more analysis of programming languages. Post 5 will look at digital sales.
 State of the Computer Book Market 2011 — All five parts of Mike Hendrickson’s computer book market report are collected in this free ebook. Available in EPUB, Mobi and PDF formats.
